Optical Fibre Observer
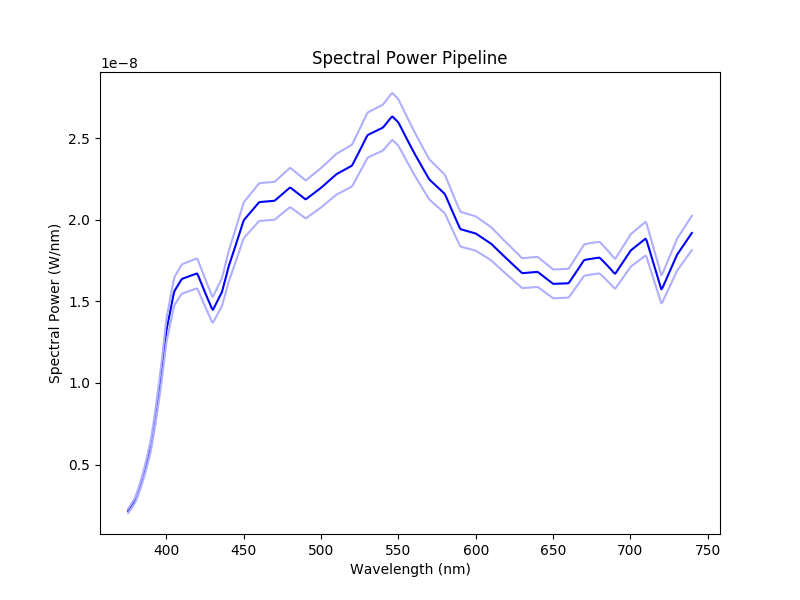
An example of spectral observations from an optical fibre.
# External imports
import matplotlib.pyplot as plt

# Raysect imports
from raysect.primitive import Sphere, Box
from raysect.optical import World, translate, rotate, Point3D, d65_white
from raysect.optical.material import Lambert, Checkerboard
from raysect.optical.library import schott
from raysect.optical.observer import FibreOptic, PowerPipeline0D, RadiancePipeline0D, SpectralPowerPipeline0D, SpectralRadiancePipeline0D


# Box defining the ground plane
ground = Box(lower=Point3D(-50, -1.51, -50), upper=Point3D(50, -1.5, 50), material=Lambert())

# checker board wall that acts as emitter
emitter = Box(lower=Point3D(-10, -10, 10), upper=Point3D(10, 10, 10.1),
              material=Checkerboard(4, d65_white, d65_white, 0.1, 2.0), transform=rotate(45, 0, 0))

# Sphere
sphere = Sphere(radius=1.5, transform=translate(0, 0.0001, 0), material=schott("N-BK7"))


# 3. Build Scenegraph
# -------------------

world = World()
sphere.parent = world
ground.parent = world
emitter.parent = world


# 4. Observe()
# ------------

plt.ion()
spectral_power = SpectralPowerPipeline0D()
spectral_radiance = SpectralRadiancePipeline0D()
power = PowerPipeline0D()
radiance = RadiancePipeline0D()
fibre = FibreOptic([spectral_power, spectral_radiance, power, radiance], acceptance_angle=10, radius=0.0005,
                   spectral_bins=500, spectral_rays=1, pixel_samples=1000, transform=translate(0, 0, -5), parent=world)
fibre.observe()

plt.ioff()
plt.show()